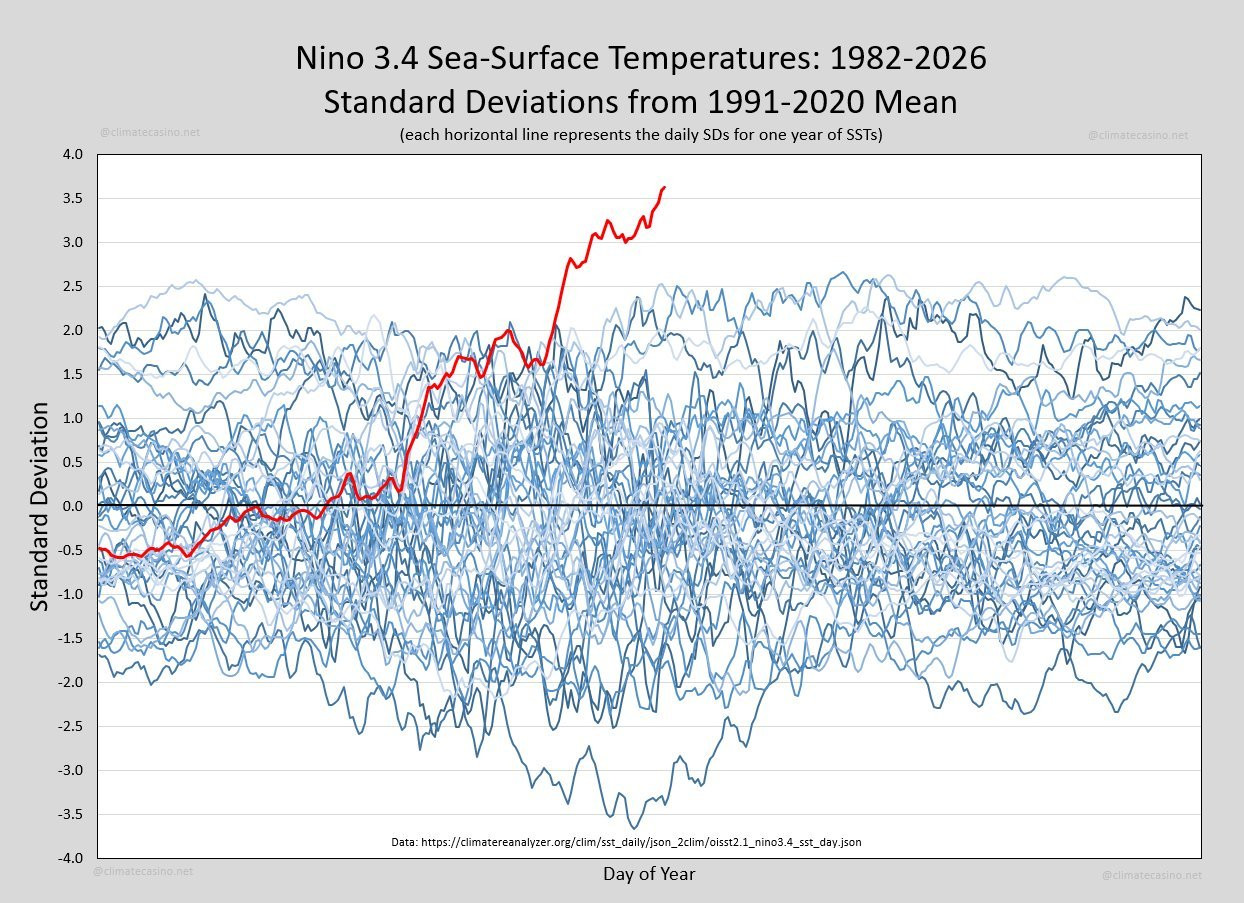
Every so often the Earth produces a signal that is impossible to ignore. This graph is one of them. It shows sea-surface temperatures in the Niño 3.4 region of the equatorial Pacific, one of the most important parts of the Earth's climate system. Each blue line represents a different year since 1982. The red line is this year. It doesn't just set a new record. It has departed entirely from the range of previous observations.If this graph represented stock market prices, a new Olympic record or a


God controls the climate. Duuuuh. When your crops fail your people starve that’s just God giving you the middle finger.
Should have given those crops Brawndo. Brawndo’s got what crops crave.